


lesson 3.13.4 analysing the data
Finding Trends and Patterns with Pivot Tables


Hi there, data detectives! 🕵️♀️ So far, you've learned how to grab and clean up huge sets of data. But what's the point of having all that data if you can't find the secret story it's trying to tell you? Today, you're going to learn one of the most powerful skills a Data Scientist has: using Pivot Tables. Think of it as a super-tool that lets you twist, turn, and summarise your data in seconds to find amazing patterns and trends. This is how companies like Netflix figure out what shows you might like, and it's a key step in turning messy data into valuable knowledge!
Learning Outcomes
The Building Blocks (Factual Knowledge)
The Connections and Theories (Conceptual Knowledge)
The Skills and Methods (Procedural Outcomes)
Recall the purpose of software tools for exploring and visualising datasets.
Describe a pivot table as a tool used to summarise, group, and analyse large amounts of data.
The Connections and Theories (Conceptual Knowledge)
s how patterns found within large datasets can be used to gain insights or make decisions.
Evaluate how a pivot table is an effective tool for turning raw data into useful information and knowledge.
The Skills and Methods (Procedural Outcomes)
Apply sorting and filtering features within a pivot table to interrogate a dataset.
Create a simple pivot table to answer a specific question about a dataset.
Digital Skill Focus: Create and modify a pivot table to interactively explore and summarise a dataset.
From Messy Lists to Amazing Insights!
You've learned how to import and clean messy data, but how do you find the story hidden inside it? If you had thousands of sales records, finding the most popular item by sorting and counting manually would take forever. The solution is a Pivot Table.
A Pivot Table is a powerful spreadsheet tool that instantly summarises and reorganises your data. You can "pivot" your view of the data (swapping rows and columns) to quickly turn a huge, flat list into a neat summary table that answers specific questions.
It's one of the most important tools for any Data Analyst.

Task 1 Pivot Prediction
Grab a copy of the "Pivot Prediction" sheet from your teacher or print one for yourself.
Look at the simple data table below which shows what some students ordered from the tuck shop on various days.

Tuck shop sales
Imagine you created a pivot table from this data to answer the question...

The pivot table is set up to show the...
Day as the ROWS
Item as the COLUMNS and
Count of the items as the VALUES.
The empty pivot table looks like this...
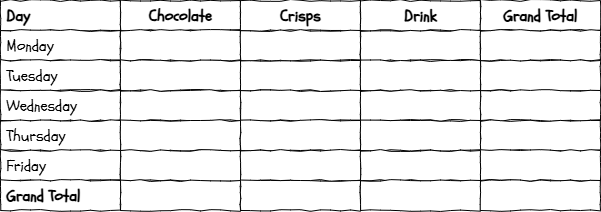
Complete the missing values from the dataset. Use the worksheet to help you complete the task.
Outcome: I can understand how a pivot table groups and summarises data by predicting the output for a simple dataset.

Your First Pivot Table
Now it's time to use the real thing! We are going to use a real dataset to ask some really important questions really quickly. We're going to follow the Use-Modify-Create model to build up your skills.

Task 2 Tuck Shop Detective
1
Get Organised
Download the tuck-shop-sales.xlsx spreadsheet and open it from the download notification.
Remember to click the Enable Editing button on the yellow bar if it appears.
Organise your workspace so that you can see these instructions and the spreadsheet at the same time.
2
USE
Before we start messing, let's have a look to see what's already there.
1
Click on the raw tab and look carefully at the data. Make sure you understand the structure.
2
Click on the sales by category tab. It contains a pre-made pivot table designed to answer the question...

...by using
Category as the ROWS.
SUM of Total Sales as the VALUES.
3
Can you answer the question now?
3
MODIFY
Time to make some simply changes to the model we were given to answer a more detailed question.
1
Click anywhere inside the pivot table. The PivotTable Fields panel should open on the right hand side of your screen.
2
You should see the Category field listed in the Rows area and the SUM of Total Sales listed in the Values area. That's correct for the first model.
3
Let's answer a more detailed question...

In order to answer this we need to add a second level of filtering by adding the Day field as the COLUMN.
4
Click on the Day field in the fields list to select it. Then click and drag the Day field from the fields list into the Columns area. You should immediately see a new column for each day added to the Pivot Table. Cool.
5
Can you answer the question now?
4
CREATE
Now, it's your turn to build something from scratch.
1
Switch back to the raw tab.
2
Select columns A through H using the column headers.
3
Click Insert > PivotTable (> From Table/Range).
4
Accept the default options on the dialoge box.
5
A new tab will be created at the start of the tabs called Sheet1 with an empty pivot table.
6
Double click the tab and rename it to item by category
7
Drag the tab to the far right of the tab group.

8
Let's design a PivotTable to answer the following question...

Click the Item label to select it. Now click and drag it into the Columns area.
Click the Category label to select it. Now click and drag it into the Rows area.
Click the Quantity label to select it. Now click and drag it into the Values area. Excel will automatically choose to SUM the values as this is the most common action.
9
Can you answer the question now?
Outcome: I can use, modify, and create my own pivot table to summarise a large dataset and answer a specific question.

Out of Lesson Learning


Last modified: April 13th, 2026

")
")
")
")
")
")
")
")
")
")


